We intend to conduct research on the evolutionary processes of various organisms. Every organism, except for the initial one, is newly created through the evolution of an existing organism. In this context, the existing organism is defined as the parent organism, and the newly created organism is defined as the child organism.
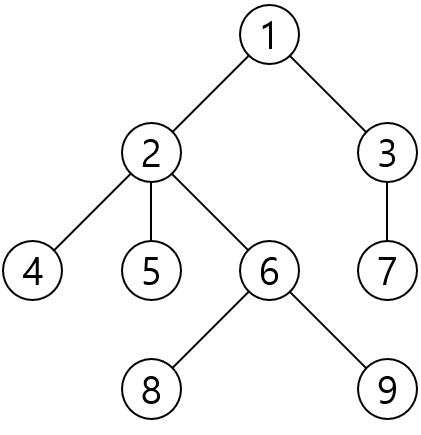
The process by which organisms are created through evolution can be represented as a tree structure rooted at the initial organism, where organisms are vertices and evolutionary processes are edges connecting parent and child organisms. For example, the figure below represents a process where organism 1 evolves into organisms 2 and 3, organism 2 evolves into organisms 4, 5, and 6, organism 3 evolves into organism 7, and organism 6 evolves into organisms 8 and 9, with organism 1 as the root. Let us call this tree an evolutionary tree.

For each organism that has child organisms, we intend to classify one of the possible evolutionary methods as the "major evolution" for intensive analysis, and classify the remaining evolutionary methods as "minor evolutions."
The efficiency of this classification method can be determined by measuring the evolutionary complexity. The evolutionary complexity between two organisms A and B is defined as the number of minor evolutions passed on the simple path connecting organisms A and B in the evolutionary tree. The evolutionary complexity of an evolutionary tree is defined as the maximum value of the evolutionary complexity for all pairs of organisms.
As the evolutionary complexity increases, it becomes more difficult to analyze the relationship between two organisms, so a lower evolutionary complexity of the evolutionary tree is a more efficient method. Therefore, we must appropriately classify major and minor evolutions to minimize the evolutionary complexity of the evolutionary tree.
The research is conducted over $N + Q$ days. On the first day of the research, only organism 1 has been discovered, and on each subsequent day, one of the following two types of research is conducted:
- Discover a new organism that evolves from an already discovered organism. If the number of previously discovered organisms was $T$, this organism is named organism $T + 1$. This research occurs $N$ times.
- For a given organism, analyze the organisms that are created through 0 or more evolutions from that organism. For the evolutionary tree formed by taking that organism as the root, find the minimum value of the evolutionary complexity of the evolutionary tree. Note that each analysis is independent, and the classification method used in this analysis does not affect later analyses. This research occurs $Q$ times.
Write a program that carries out this research plan.
Implementation Details
You must implement the following three functions:
void init()- This function is called exactly once before any
observationoranalyzefunctions are called.
void observation(int P)- For the integer $P$ given as an argument and the current number of discovered organisms $T$, this function signifies that a new organism $T + 1$ has been discovered, which evolves from organism $P$.
int analyze(int R)- For the integer $R$ given as an argument, this function signifies that you are to analyze the organisms created through 0 or more evolutions from organism $R$.
- This function must return the minimum evolutionary complexity of the evolutionary tree formed by taking organism $R$ as the root.
You must not execute any input/output functions in any part of the source code you submit.
Constraints
- $1 \le N \le 500\,000$
- $1 \le Q \le 500\,000$
Subtasks
- (7 points)
- $N \le 15$
- $Q \le 15$
- (11 points)
- $N \le 3000$
- $Q \le 15$
- (5 points)
- The parent of organism $i$ is organism $\lfloor \frac{i}{2} \rfloor$. ($2 \le i \le N + 1$)
- (21 points)
- Each organism has at most 2 child organisms.
- (15 points)
- $N \le 3000$
- $Q \le 3000$
- (41 points)
- No additional constraints.
Note
The score for each subtask is the minimum score among all data points within that subtask.
Examples
Input 1
init()
observation(1)
observation(1)
observation(2)
observation(2)
observation(2)
observation(3)
analyze(1) = 2
observation(6)
analyze(2) = 2
observation(6)
analyze(6) = 1
analyze(1) = 2
Note
The 4 figures below represent the evolutionary tree considered in each analyze call and one of the optimal classification methods. Major evolutions are shown in bold.
Sample grader
The sample grader receives input in the following format:
- Line 1: $N'$
- Line $1 + i$ ($1 \le i \le N'$):
1 Pifobservation(P)is called,2 Rifanalyze(R)is called.
$N' = N + Q$ is satisfied.
The sample grader outputs the following:
- Line $i$ ($1 \le i \le Q$): The value returned by the $i$-th
analyzefunction call.
Note that the sample grader may differ from the actual grader used for evaluation.