Little W is the manager of a newly built cemetery. The cemetery can be viewed as an $N \times M$ rectangle. Each grid point in the rectangle either has an evergreen tree planted on it or is an unoccupied burial plot.
The local residents are very devout Christians who wish to find a suitable burial plot for themselves in advance. To demonstrate their sincerity to the Lord, they hope their burial plot has a high level of "piety."
The piety of a burial plot is defined as the number of "crosses" centered at that plot. A cross is defined as having exactly $k$ evergreen trees directly above, directly below, directly to the left, and directly to the right of the burial plot.
Little W wants to know the sum of the piety levels of all burial plots in the cemetery he manages.
Input
The first line contains two space-separated positive integers $N$ and $M$, representing the width and length of the cemetery. Thus, the rectangular cemetery has a total of $(N+1) \times (M+1)$ grid points, with the bottom-left corner at $(0, 0)$ and the top-right corner at $(N, M)$.
The second line contains a positive integer $W$, representing the number of evergreen trees in the cemetery.
The next $W$ lines each contain two space-separated non-negative integers $x_i$ and $y_i$, representing the coordinates of an evergreen tree. It is guaranteed that no two evergreen trees have the same coordinates.
The last line contains a positive integer $k$, as defined in the problem.
Output
Output a single non-negative integer representing the sum of the piety levels of all burial plots in the cemetery. For convenience, the answer should be taken modulo $2,147,483,648$.
Examples
Input 1
5 6
13
0 2
0 3
1 2
1 3
2 0
2 1
2 4
2 5
2 6
3 2
3 3
4 3
5 2
2
Output 1
6
Note
In the figure, the crosses centered at burial plots $(2, 2)$ and $(2, 3)$ each have a count of $3$, meaning their piety levels are both $3$. The piety levels of all other burial plots are $0$.
Constraints
For 30% of the data, $1 \le N, M \le 1,000$.
For 60% of the data, $1 \le N, M \le 1,000,000$.
For 100% of the data, $1 \le N, M \le 1,000,000,000$, $0 \le x_i \le N$, $0 \le y_i \le M$, $1 \le W \le 100,000$, $1 \le k \le 10$.
There exists 50% of the data where $1 \le k \le 2$.
There exists 25% of the data where $1 \le W \le 10000$.
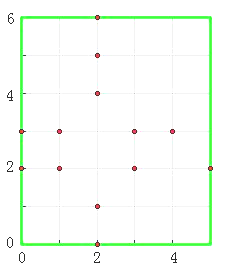
Figure 1. Visualization of the cemetery grid and evergreen tree locations based on the example input.